

BITCOIN AND THE CRYPTO BEAR MARKET
The price of Bitcoin unfortunately was down about 15% from its all-time highs last month alone (August 2022).
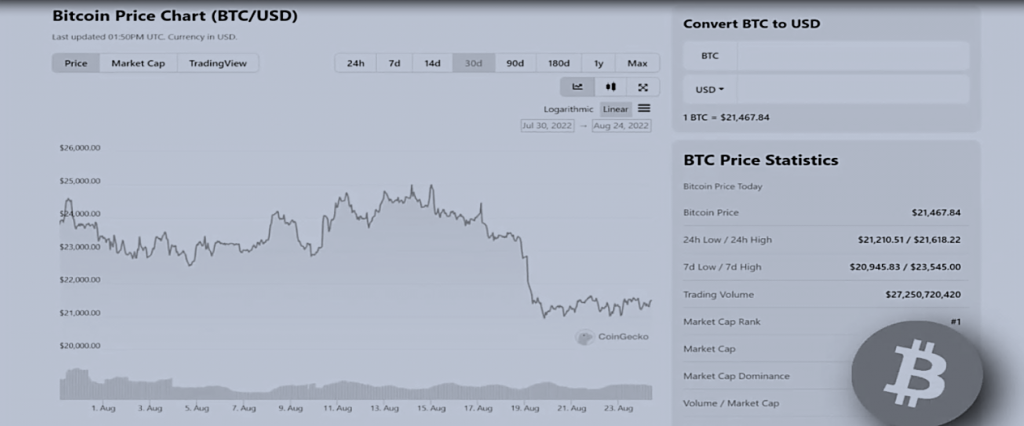
There is quite a bit of negative sentiment out there and the macroeconomic news isn’t helping things.
A lot of analysts are suggesting the uptick that we saw in crypto these last few weeks was only ever just a relief rally. But we can’t be too myopic in this space, because experts still strongly believe that Bitcoin is the way forward.

The biggest evangelists out there still hold firmly that by 2030, Bitcoin will cross a million dollars.
As a friendly reminder, whether we’re talking about Bitcoin or altcoins just keep in mind that all of this is a volatile space and there is corresponding risk when you’re involved in cryptocurrency.
This article is meant to be informative in nature. Do not take it to be official financial or investment advice.
BITCOIN INDICATORS
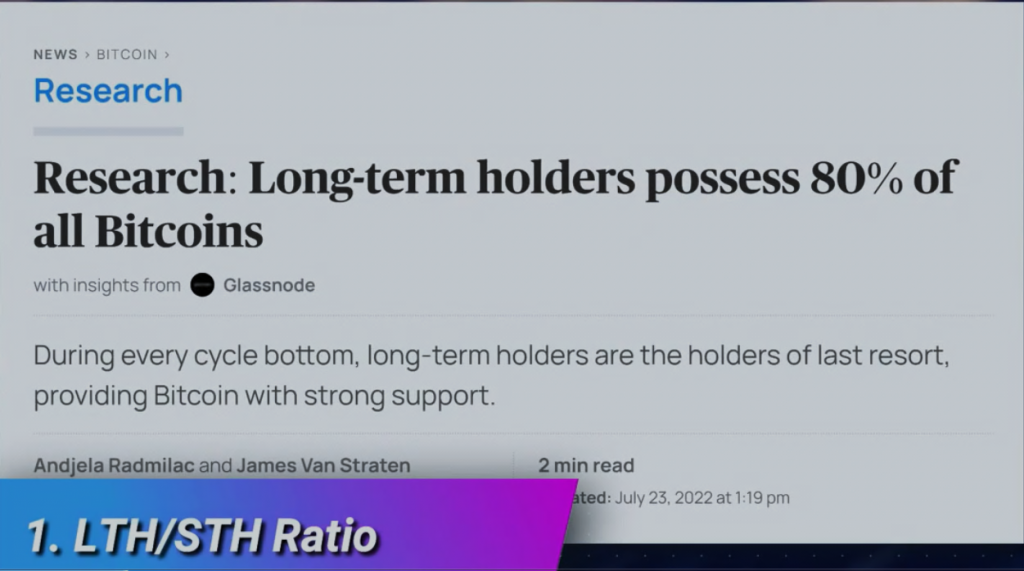
Indicator 1: LTH/STH Ratio
First Bitcoin on-chain indicator unfortunately tilts in the bearish direction. It would suggest based on the metrics that, it may not be the right time to buy Bitcoin at this moment.
As per Glassnode, 80% of the total Bitcoin supply is held by long-term holders or LTH.
So we can imagine the kind of impact that LTH has on the market is pretty substantial.
LONG-TERM HOLDERS (LTH)
These are wallets holding Bitcoin for more than 155 days, which is just under six months.
SHORT-TERM HOLDERS (STH)
These are wallets holding for less than 155 days.
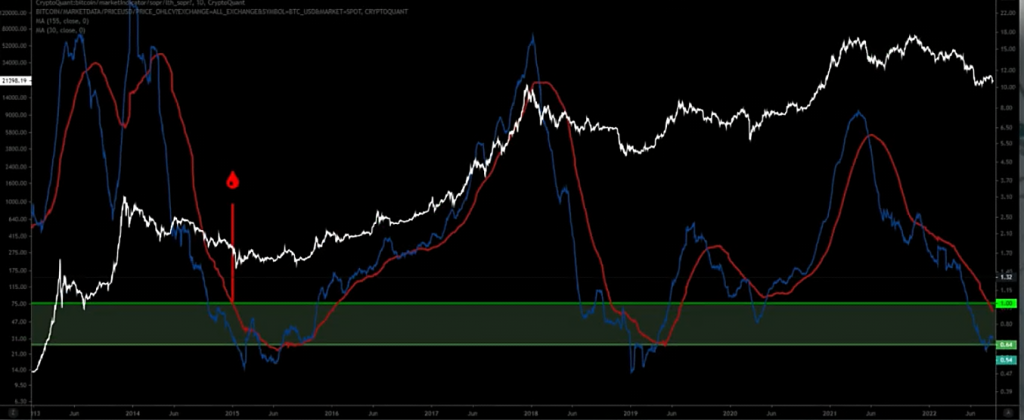
At any given point in time, you can look at the ratio of LTH–STH, and then at the 155-day moving average of that ratio. With that, you can decide whether you should buy, sell or hold. At present, this chart seems to be giving us a big signal that we could be looking at a correction from here.
There’s also another event happening that could lead to a further correction. But before we talk about that, let’s take a closer look at this particular chart.
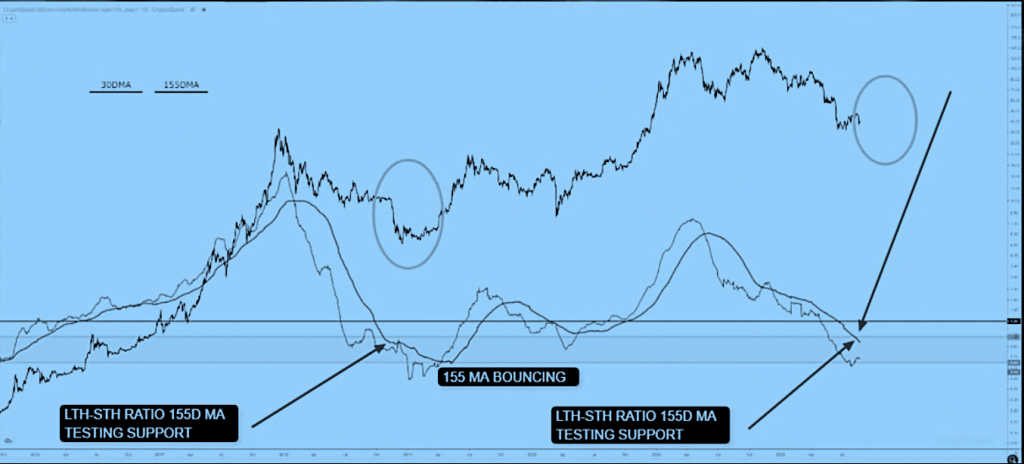
So it’s very evident in the image that the moving average is dipping back below one. Now the last two times the moving average (MA) moved from above one to below one were in 2016 and 2018.
And the market declined subsequently right after.
We’re also seeing money flowing out of big caps into small caps. And so if a correction does happen, it’s just another chance to add to our long-term bags. Again, that’s the silver lining as we look at it. We have to view the opportunity in every catastrophe, even sub-catastrophes.
Mt. Gox Bitcoin
The other event that could very well lead to further correction is that Mt. Gox Bitcoin is getting ready to hit the market. It’s 137,000 BTC or $2.8 billion worth of Bitcoin at today’s prices.

Can the market absorb all this Bitcoin?
Probably, yes.
But can the market absorb all this Bitcoin without any downward pressure on price?
That’s not so certain. In fact, probably not unless the repayments are on a staggered basis over many different tranches. We always want to hope for the best but we must prepare for the worst and in that spirit, it may be best for you right now to brace for another deeper correction.
Indicator 2: Market Value to Realized Value
Our second big indicator is bullish. It purports to tell us when the market will potentially move up.
MVRV or MARKET VALUE TO REALIZED VALUE:
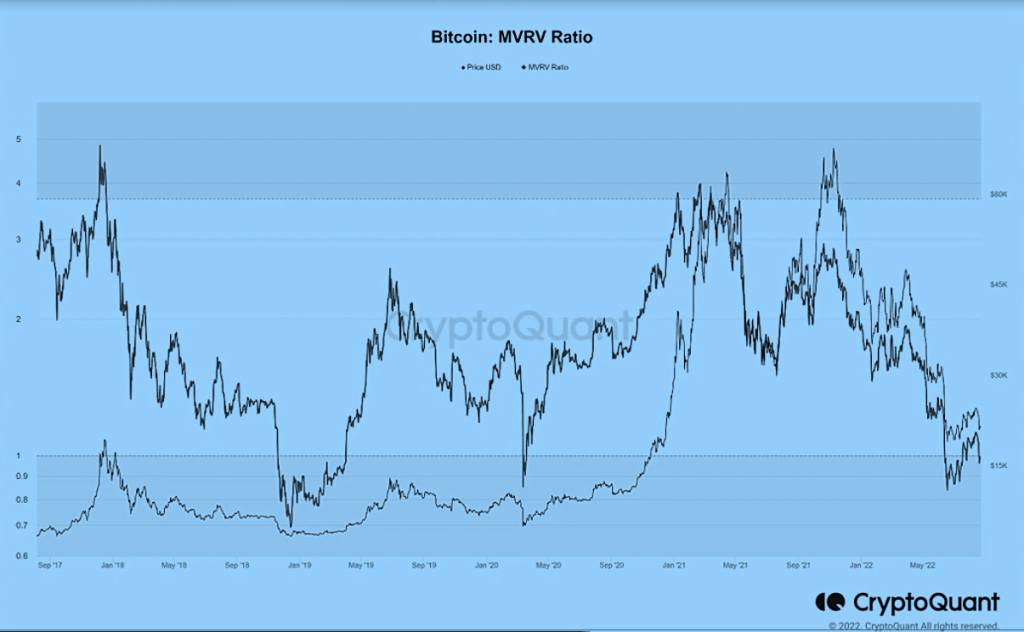
Right now it shows that we are near the market bottom. Often this metric bottoms out at 0.9. And at this level, weak hands have been flushed out. Only strong hands that intend to keep hodling Bitcoin remain.
Don’t be confused if we already had one bearish and one bullish indicator. Sometimes these indicators can be conflicting, but we got to examine them in their totality.
Indicator 3: Spent Output Profit Ratio
We’re looking at Bitcoin selling pressure here. This indicator is oscillating us back towards bearish.
If there’s one thing that we’ve said, really from the beginning of this bear market, including the Luna fiasco, and Three Arrows, all that stuff, it’s the fact that the market problem is a liquidity problem. Because lack of liquidity leads to lots of forced liquidations and redemptions that we’ve seen that unfortunately, we continue to see.
Adjusted Spent Output Profit Ratio (SOPR) is a way to measure liquidity specifically.
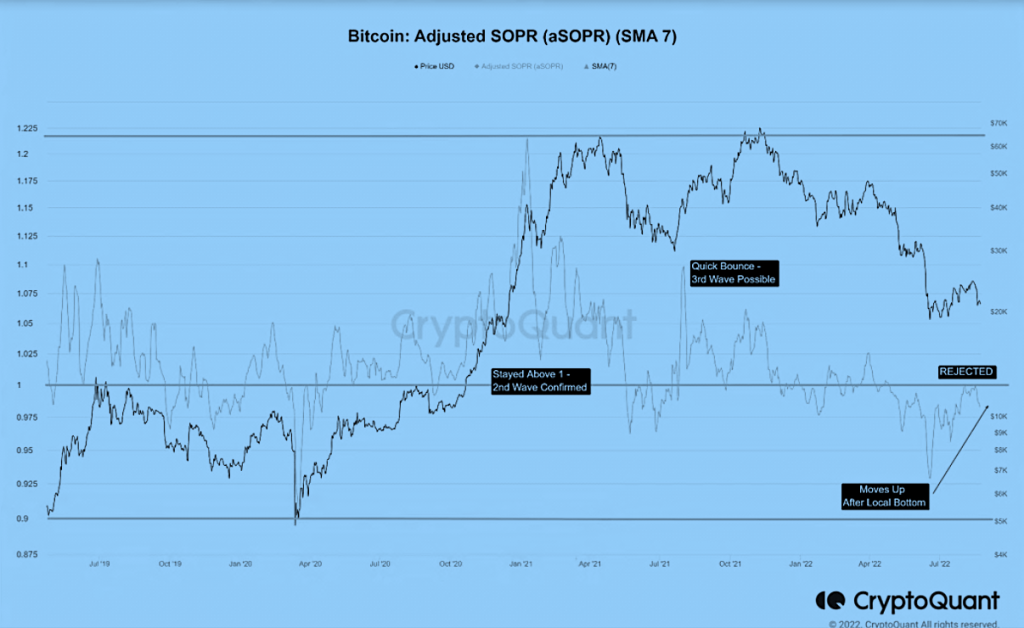
It measures all wallets that are at least one hour old. So it’s how profitable holders effectively are with transactions that are at least one hour old.
This eliminates very short-term traders, some day traders, and scalp traders and therefore paints a more representative picture and as it can be seen in this image, the adjusted SOPR is rising, meaning holders are more profitable once again.
This increases the chances of selling because they have an opportunity to sell at a profit.
This new liquidity, especially combined with the Mt. Gox coins could easily create a flash crash.
In this market, we don’t see enough demand on the buy side to absorb this new liquidity if it comes to the market.
But for every bearish scenario, there is a flip side bullish scenario.
Indicator 4: Declining Open Interest
For the last indicator, we are considering a bullish scenario in the form of open interest which is declining.
Open interest is the number of futures contracts out there in the market. Every time someone opens a new futures position, it adds one to the total open interest. Closed positions reduce open interest.
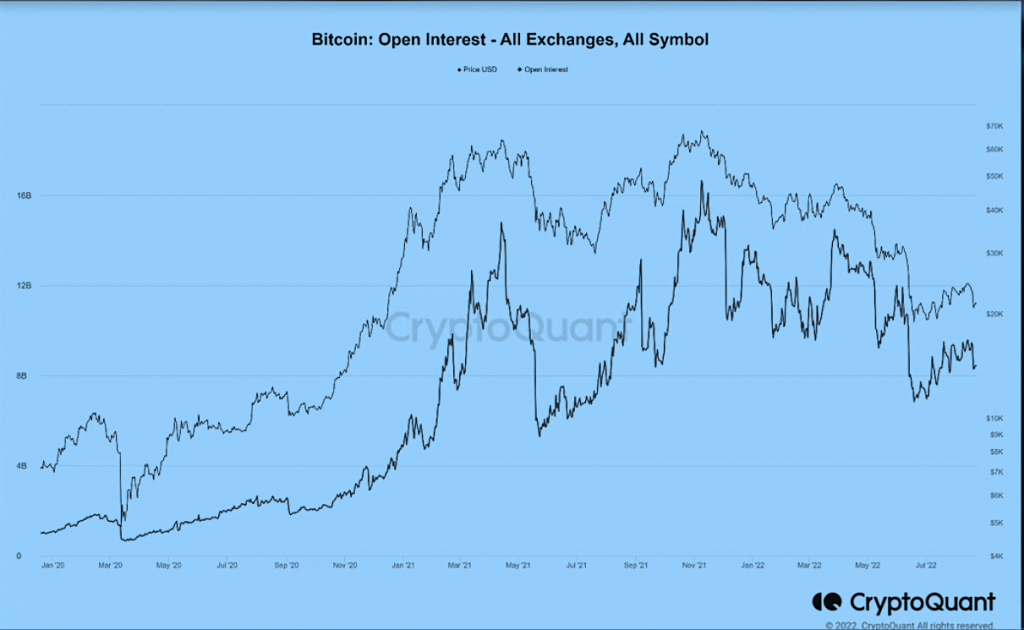
Right now, open interest is declining, which is a good thing.
People are closing their positions, which is a bullish sign because it means that there is more potential for a short squeeze.
Because there are not really a lot of short futures positions out there.
A short squeeze is when the shorts help add to a rally by having to buy to cover their unprofitable short positions.
In general, there are far too many futures positions in this space. Far too many leveraged and over-leveraged positions. So a decline in this metric is a good thing.
So it’s a mixed bag of indicators.
But in the end, we do have;
- Two bullish indicators- MVRV and the decline in open interest
- Two bearish indicators- LTH–STH and adjusted SOPR
So what should you do now?
If you’ve been dollar cost avering (DCA) into Bitcoin, then all you have to do is continue that strategy.

It looks like things are neutral to bearish in the short term with good potential for this to be the last leg down.
That’s if there’s no huge macro event that pulls everything downward because those kinds of black swan events are unfortunately always a possibility, especially in cryptocurrency.
We think the last big bear leg down and the long-term buying opportunity of this bear market is going to happen sometime in September or possibly October.